Which states are ready to reopen? State of Coronavirus in America


The nation has made great progress in “flattening the curve” of COVID-19 in the last month, and many parts of the US will soon begin a phased reopening of their economies according to federal guidelines announced on April 16.
Phase 1 of the reopening will be based on infection rates observed by states and the Centers for Disease Control—and will maintain strict controls on social distancing. After a two-week period of demonstrating continued progress, states can move into Phase 2. The White House Coronavirus Task Force noted that about 29 states already do, or soon will, meet the criteria to begin Phase 1.
The task force did not specify which states, preferring to leave announcements to governors. Yet the number of states aligns closely with observations made in the first two State of Coronavirus in America reports (links here and here), published by Public Square in the last two weeks. In this report I take a closer look at state impacts and trends to determine which states are likely to move quickly into the phased reopening, and which states will maintain the status quo until the spread of the virus recedes further. The coronavirus has impacted every city and town in America—and communities won’t begin to understand the extent of its impacts until the immediate crisis is over.
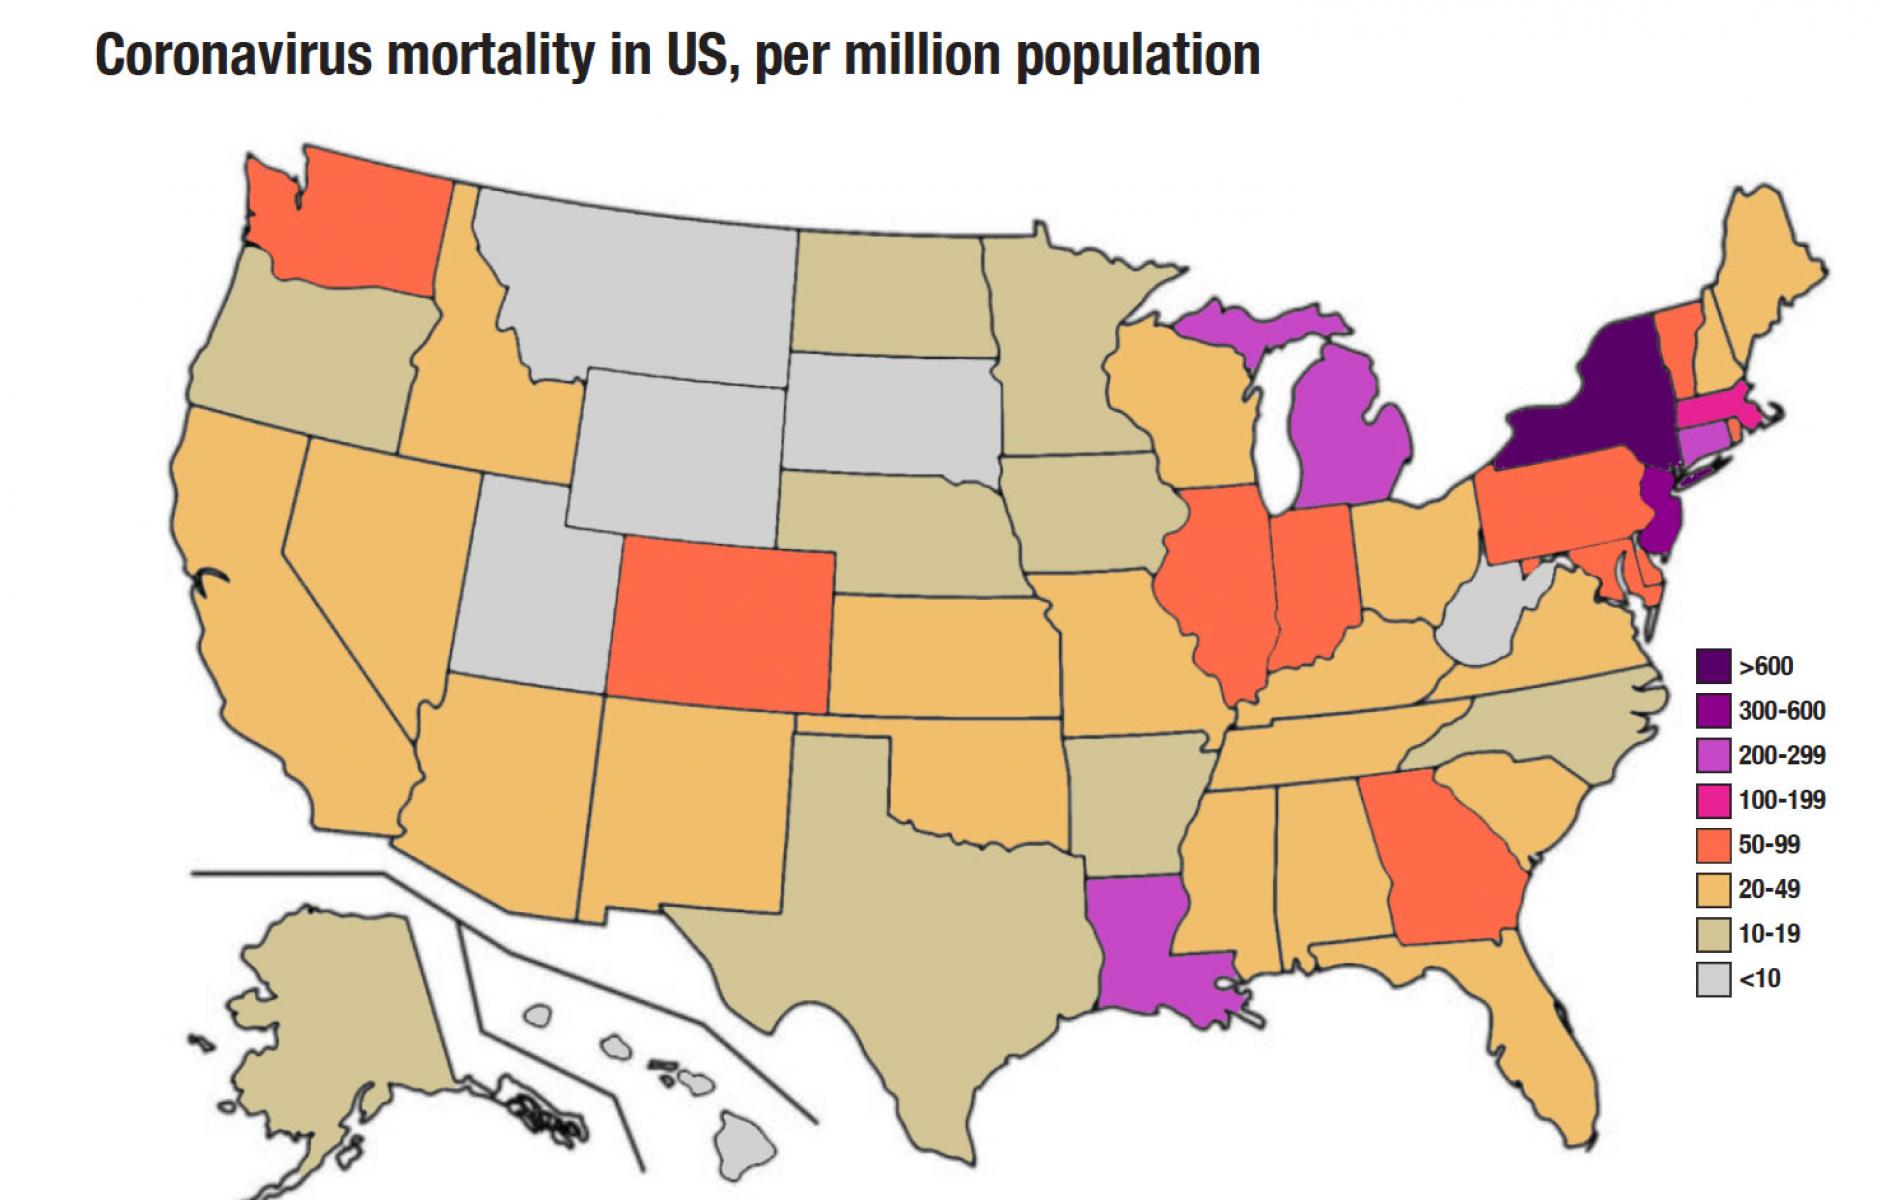
Unlike many news reports, State of Coronavirus in America uses per capita figures, which provide an apples-to-apples comparison of geographic areas with widely differing populations. The map at the top shows per-capita mortalities. Some states, like California, Texas, and Florida, have large totals but relatively low per capita rates. California’s mortality rate has been rising in the last few days, but cases have generally plateaued and hospitalizations are down.
These states and others will likely be able to move more quickly than the states shown in purple, red, and deep orange. Texas announced today that it will move into phase 1. States west of the Mississippi River tend to have low relative rates.
This past week has been the worst for the nation so far, with the most death. And yet regions across the US are seeing a plateauing of new coronavirus cases, despite more widespread testing. In some regions, the cases are trending down. The graphs below show new per capita cases in regions of the country. These graphs highlight the relative impacts on regions—especially the tremendous toll on the Northeast.
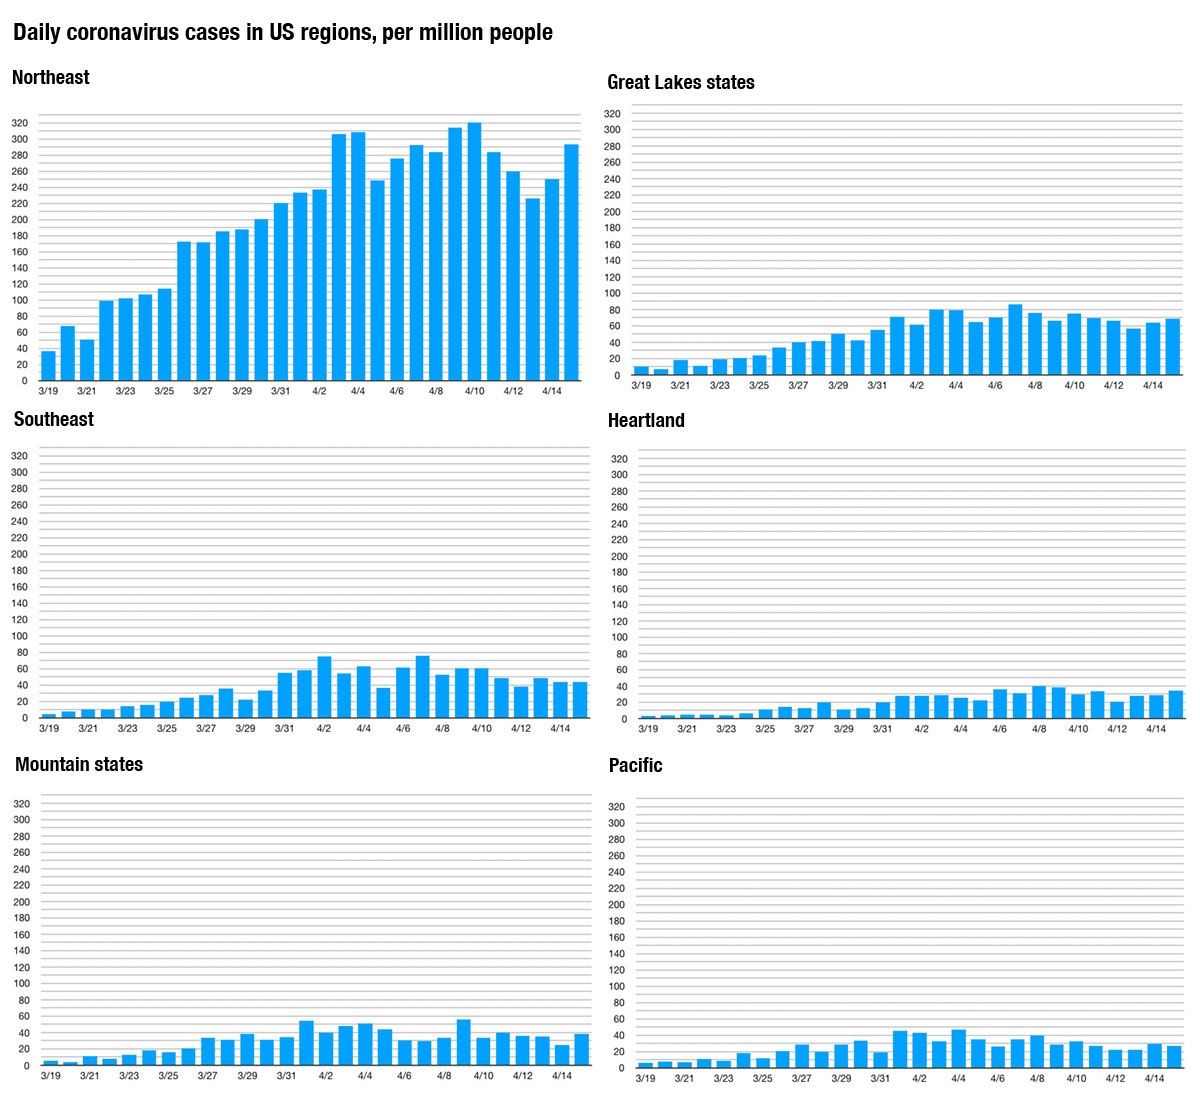
The lowest levels of coronavirus cases have been identified in the nation’s Heartland (generally the Great Plains), the Rocky Mountain states, and the Pacific region (graphs show data through April 15).
The reopening of the economies will take place on a state-by-state basis based on virus spread and impact. The most severe impact is mortality, and the table below shows per-capita rates of individual states, from lowest to highest. The states in dark green are mostly west of the Mississippi River with the exception of West Virginia—which is surrounded by states where the virus has taken a heavier toll—and North Carolina. Alaska and Hawaii are geographically isolated, which partly explains their low mortality rates. The nation’s three greatest “hotspots,” the New York City metro area (New York, New Jersey, Connecticut), the Detroit area (Michigan), and the New Orleans area (Louisiana), are part of states colored red.
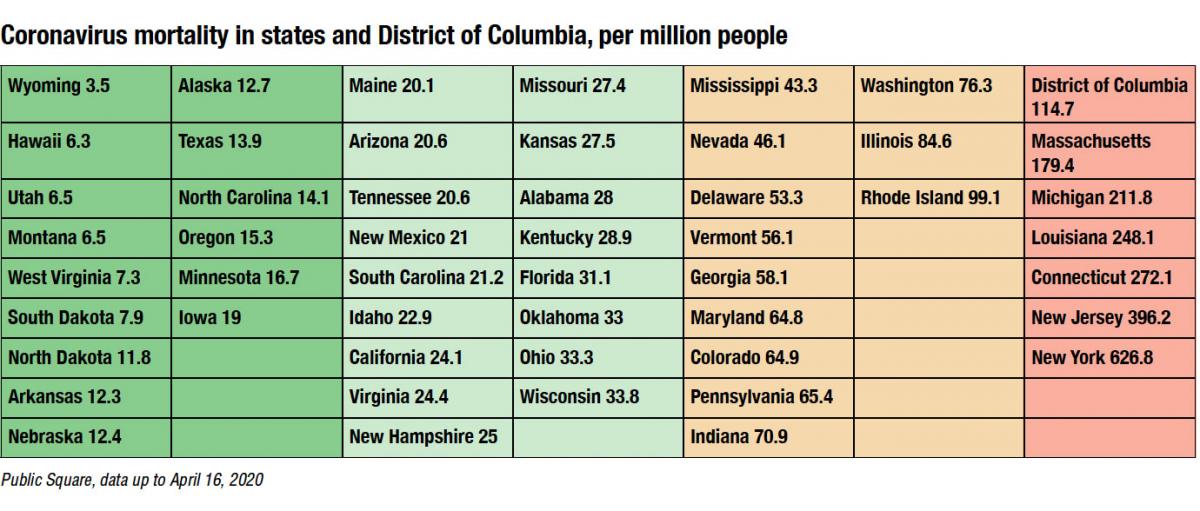
New York’s mortalities hit a peak on April 9, and have been declining in recent days. This has coincided with decreasing hospitalizations. In other hard-hit states like Louisiana, Michigan, Massachusetts, and Illinois, the mortalities have continued to rise this week, although there are other, more positive, signs. Cases in Illinois dropped yesterday to the lowest level since April 6. The state has expanded testing to include people with mild symptoms, a change that is happening in other states, like Michigan.
The table below shows cases per capita, and comparison with the first table is useful. The two tables align in many respects, but not in every case. South Dakota, for example, is one of only a few states with less than 10 per capita deaths, yet the state is on the third tier of identified cases. That discrepancy is due to the well-publicized outbreak at the Smithfield Foods meat packing plan in Sioux Falls, where more than 500 workers have tested positive since early April. Although the outbreak is very localized, it may impact South Dakota moving into phase 1. The outbreak has yet to show up in the mortality rate for the state, where, remarkably, only one coronavirus death has occurred in the last nine days. The Smithfield incident will test how well government can respond to localized outbreaks that are bound to occur as states move to reopen businesses and activities.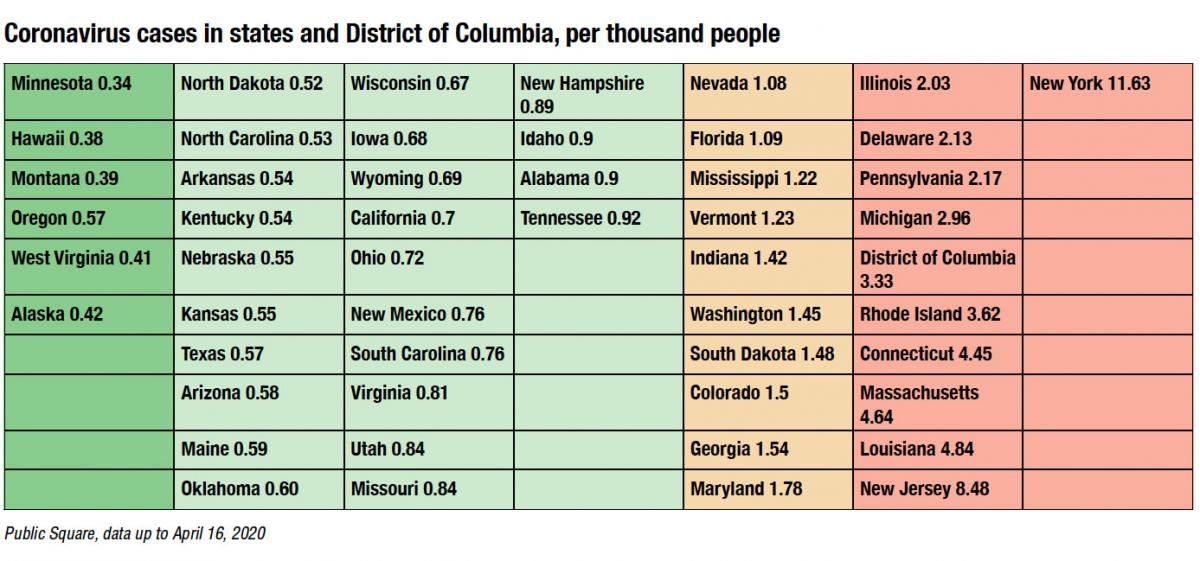
Minnesota has the lowest rate of confirmed cases in the US, which is notable since the state also includes a major metro area (the Twin Cities). Minnesota is also in the lowest tier of mortality. Oregon, which includes Portland, has also been hit relatively lightly. Oregon is next to Washington, where the virus first entered the US in late January. Mortalities and cases have trended downward in Washington State since early April.
In the coming weeks, the nation, states, and local governments will need to double down to contain the spread in the worst-hit areas, maintaining the progress that has been achieved. The current success in keeping numbers down in the rest of the nation must also continue, even as some of these states begin to open up activities.
Much of this will depend on testing, tracing, and isolation of those with the virus. The testing is still being expanded, and there is excess national capacity now, according to the White House task force—although this capacity varies locally. The contacts of positive tests must be traced so that these people can be warned and tested. For the coming weeks, Americans will continue to be asked to maintain social distancing and the majority will likely remain at home.
The numbers also warn about the critical importance of protecting vulnerable populations, especially the elderly. Many of the deaths are occurring in nursing homes, and sometimes a single facility can impact the mortality rate for an entire state. That happened in Virginia this week, when the death rate spiked one day because of a single facility in Richmond. Protecting the elderly and other vulnerable populations will be part of a “new normal” until a vaccine is developed.