Cities don't increase virus risk


More than a month ago, I wrote that the “facts don’t support the density is dangerous narrative” that was spreading in the wake of the coronavirus crisis. In mid-March, many articles speculated that the current crisis will lead to a new wave of suburban development as people flee cities.

The narrative makes sense on the surface: New York City is, by far, the densest city in North America, and it is also the epicenter for COVID-19 on the continent. People travel on crowded trains in New York City in numbers that drawf any other metropolis. My initial research analysis called into question whether density is a significant factor, when places of hugely different densities were getting the same number of, or fewer, cases. More recent analysis by City Observatory—see table below—supports my observations, and also calls into questions whether public transit plays a significant role in the spread of the disease.
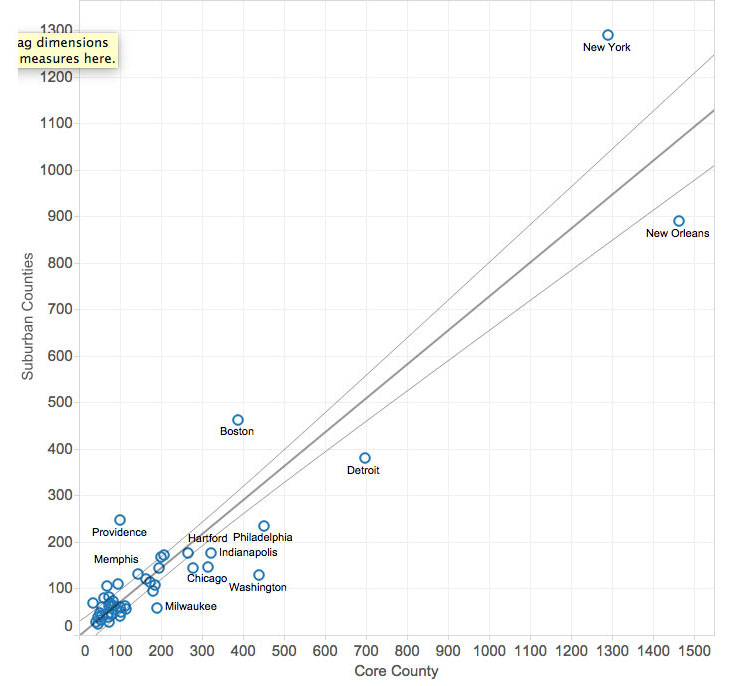
The graph, from the article “Why suburbs aren’t safer from the pandemic than cities” shows the number of cases per capita in dense core cities relative to low-density suburbs. According to City Observatory, the metro area you live in is far more important in determining your risk of getting the virus, relative to whether you live in a low-density or high-density neighborhood. In other words, it makes little sense to move out of the city to a leafy suburb to reduce risk from a pandemic like COVID-19.
New Orleans, for example, has nearly 10 times the number of cases per capita than San Francisco. New Orleans is one-ninth the density of San Francisco. The strong correlation is in the opposite direction to density. Comparing the rates of the virus within metro areas reveals some correlation between density and rates of infection, but much less than some expect. “While suburbs have, on average, somewhat lower reported case counts per 100,000 population, most of the variation is explained by what metro you live in, not whether you’re in a city or suburb. There’s about a 0.9 correlation (the R² is .86) between the city and suburban prevalence rate, and on average, the suburban rate is about 73 percent as high as the urban rate.”
The higher rates in cities can be explained by many factors not involving density. “There may be a variety of reasons why cities might have higher rates of reported cases. Cities may have more vulnerable populations, and higher concentrations of people with limited access to medical care,” notes City Observatory.
Moreover, there are many exceptions to the general trend. New York City suburbs have a per capita rate of infection that is nearly as high as the city. In some cases, the suburban rate is significantly higher. Westchester County, just north of the city, has a 47 percent higher infection rate than the city itself. The density of the city is 14.6 times higher. In the metro areas of Boston and Providence, suburban rates are higher than the core cities.
The graph also disputes the notion that transit is the key factor in spreading the virus. Many have speculated that the subway system explains why New York City is the epicenter of coronavirus in America. I speculated privately myself on that notion, but even a quick glance at the table makes the correlation highly dubious. For example, compare New York City and New Orleans, the two metro areas with the most cases per capita. In New Orleans, the rate of commuting by public transit is 7.5 percent, while in New York the figure is 55.9 percent. There is simply no correlation relating to transit use. Moreover, the two cities are on the opposite sides of the line from what you would expect if transit were the cause of the spread. In New Orleans, with low transit use, the COVID-19 rate is higher in the city. In New York City, the infection rates are relatively higher in the suburbs, where there is comparatively less transit.
The next highest metro areas, in terms of infection, are Boston and Detroit. Again, these cities have far different levels of commuting by transit. Detroit has a 5.9 percent commute by transit rate, while Boston has 32.2. percent. Boston suburbs have a higher rate of infection, relatively speaking, than Detroit suburbs. You could make the case that suburban commuters in Boston are getting infected on the way to and from work, except that use of public transit for all purposes is much higher among city residents themselves. You would expect the rates of city infection to be far higher than the suburbs, if transit were the key factor.
The more you dig into the data, the less a theory of public transit spread makes sense. Why does Detroit have a coronavirus infection rate that is 5.5 times higher than San Francisco, for example, when the California city’s use of public transit is 5.7 times greater? All of this is not to say that transit plays no role in the spread of the virus. Yet according to the data, it does not appear to be a primary factor.
No doubt we will learn a great deal, in the coming months and years, about how coronavirus is spread. But we should hold off on knee-jerk theories related to density and transit because they don’t hold up based on what we know so far. And you may want to hold off on selling that urban townhouse.
Note: We are taking CNU 28.Twin Cities online to host a virtual Congress to be held from June 10-13, 2020 that will include 55-70 sessions and a number of pre-Congress webinars. Registration is open for CNU 28.