The walkable urban trend keeps going


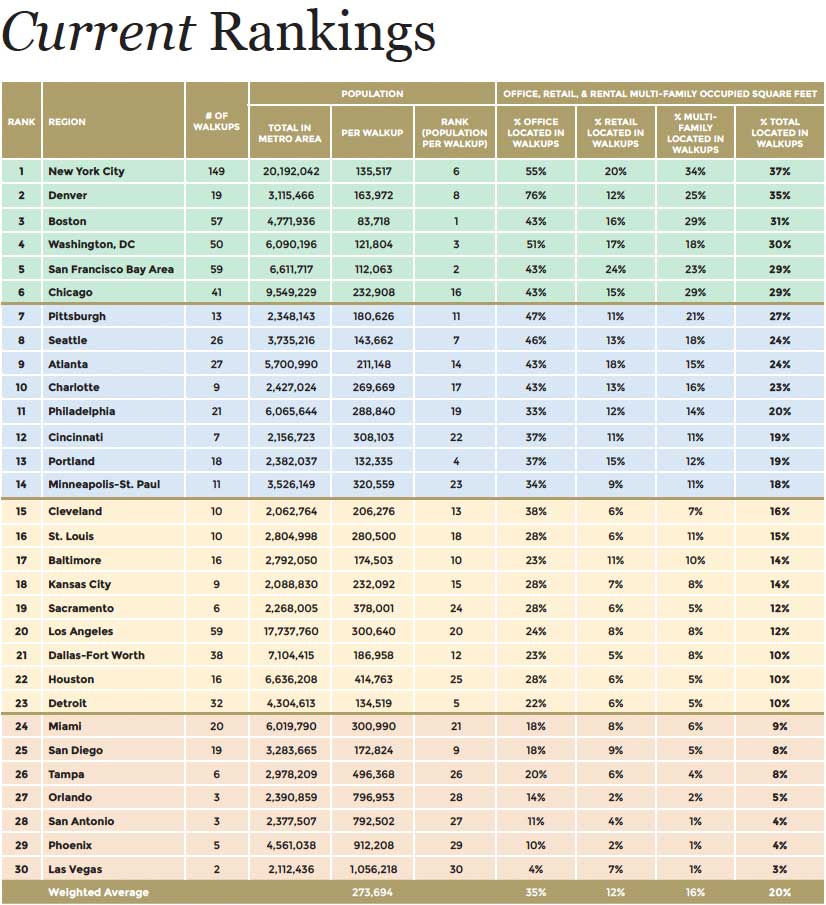
Walkable Urban Places (WalkUPs) continue to outperform other forms of real estate development in the nation’s largest metro areas, according to a new report Foot Traffic Ahead: Ranking Walkable Urbanism in America's Largest Metros • 2019. The report finds a huge unmet demand for new WalkUPs, the construction of which could drive the US economy for another generation. Metro areas that are not meeting the demand for walkable urbanism are paying the price in reduced economic performance and social equity outcomes, according to the authors.
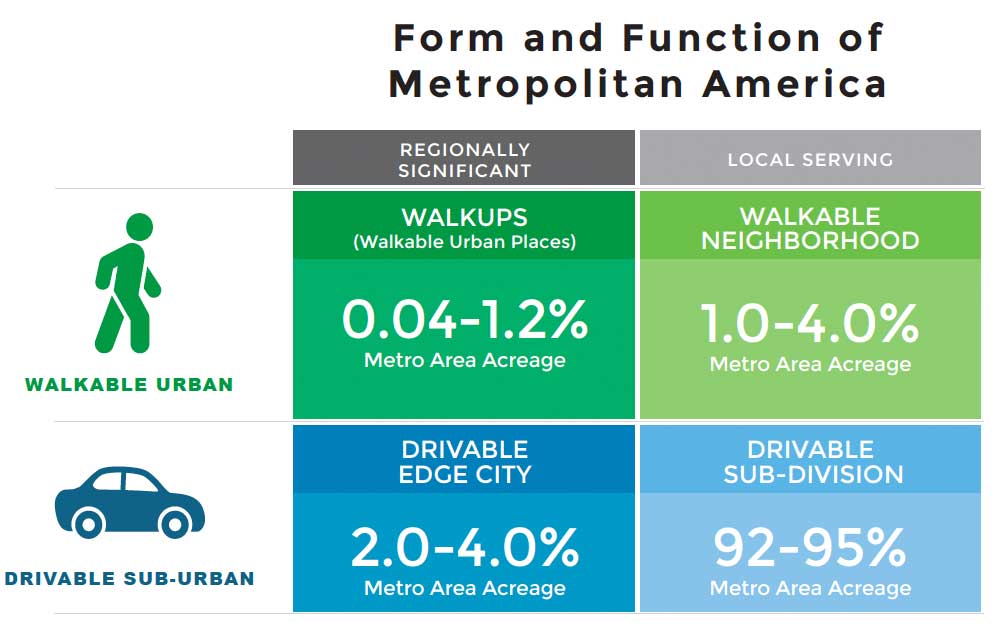
The number of WalkUPs has risen to 761, from 619, in the previous Foot Traffic Ahead report, which came out in 2016. WalkUPs are regionally significant mixed-use urban centers with substantial commercial development. Drivable suburban real estate products have been losing market share in the 30 metro areas since 2010 relative to WalkUPs. “The results of this report demonstrate a consistent and growing demand for walkable urbanism in many metro areas,” the report says.
The report was produced by the Center for Real Estate and Urban Analysis at George Washington University; LOCUS, a division of Smart Growth America; Cushman & Wakefield; and Yardi.
Foot Traffic Ahead analyzes development based on whether it meets criteria for mixed-use, walkable urban centers—referred to as “walkable urban”; as opposed to automobile-oriented commercial development—which the authors call “drivable suburban.” Both of these types of development can occur in either central city or suburban locations. The walkable urban and drivable suburban dichotomy provides a better method of real estate analysis today than the typical categorization of central city, suburban, exurban locations, the authors contend. WalkUPs take up little land in a metro area, but they have an outsized impact on the economy.
During the latter half of the 20th Century, drivable suburban development dominated commercial real estate—both in terms of volume and rent premiums. During the mid-1990s, the revival of many downtowns and a handful of new suburban town centers—accompanied by the New Urbanism movement—demonstrated a demand for walkable urban places.
This demand grew, but it wasn’t until the current market cycle, following the 2008-2009 Great Recession, that walkable urban has taken the lead in commercial real estate in major metro areas. Foot Traffic Ahead found a rent premium of 75 percent in WalkUPs, up slightly from 74 percent in 2016. For detached single-family housing, however, the drivable suburban model still predominates. “Sprawl of single-family housing has been subsidized for decades by a series of government incentives,” the authors explain. Multifamily and other commercial real estate are more market-driven, and have therefore made the shift to walkable urban, the authors contend.
However, it is still illegal to build apartments in many suburban WalkUPs, which is a strong indication that policies are still getting in the way of building walkable urban places, especially outside of central cities.
Sprawl, economics, social equity
The report rates metro areas both on economic performance and social equity, correlating these findings with the form of development. The authors conclude that promoting sprawl reduces economic performance and social equity outcomes.
Several of the largest 30 U.S. metros consistently rank near the bottom of the Foot Traffic Ahead survey on both economic and social equity performance, such as metro Tampa, Orlando, and Phoenix. Many of these metros have an uphill climb to create walkable places due to the fact that they experienced their initial period of development later in the country’s history and lack the historic urban centers or the pedestrian-scaled fabric of older U.S. metros. However, these low-ranking metros have also demonstrated an inability to change by continuing to promote drivable sub-urban development patterns in public policy and infrastructure investments, such as voting against transit investment or maintaining outdated zoning codes that mandate a certain type of development less preferred by today’s market. These metros demonstrate that focusing on sprawling, drivable sub-urban development patterns reduce economic performance and social equity outcomes.
Counterintuitively, many of the metro areas with the highest rent premiums also perform well in the social equity index. Transportation costs make a big difference. Here’s the top 10 metro areas by social equity performance:
1. New York City
2. Washington, DC
3. Baltimore
4. Minneapolis-St. Paul
5. Boston
6. Philadelphia
7. Chicago
8. Cincinnati
9. Denver
10. San Francisco Bay Area
These metros appear counter-intuitive since they include six of the highest currently ranked metros in walkable urbanism, which result in substantial rent premiums. However, the reason for this outcome is that while in the most walkable urban metros the “rent is too damn high,” (though it is not much lower in the least walkable urban metros), transportation costs for 80 percent AMI households are dramatically lower due to more diverse and less expensive transportation options, such as transit, biking and walking.
There are metros that have achieved both high economic performance at the WalkUP and metropolitan levels and have high social equity performance, demonstrating that it is possible to “do well while doing good.”
Yet the authors caution that even metro areas that perform will in social equity need to aggressively build affordable housing in the short term to ensure that lower-income households have access to living in WalkUPs.
The report finds a strong correlation of economic production and walkable urbanism.
A metro area’s current level of walkable urbanism as ranked in this research is positively correlated with GDP per capita. The six most highly ranked walkable urban metros for current walkable urbanism have an average GDP per capita of $74,656 and the seven lowest-ranked metros for current walkable urbanism have an average GDP per capita of $49,156; a 52 percent GDP per capita premium for the most highly ranked walkable urban metros over the lowest ranked walkable urban metros.
Demand for walkable urbanism
This analysis suggests that there is a potential demand for an additional 472 WalkUPs, an increase of 62 percent over the current inventory. This pent-up demand for new WalkUPs, in addition to the growth of the existing WalkUPs, would create a new economic foundation for the U.S. economy, one far more resilient than the economic foundation resulting from building drivable suburbs in the mid- to late-20th century.
Some metro areas are likely to meet this demand more than others—and that is reflected in what the authors call the Future Growth Momentum rankings, based on analyses such as market share and rent premiums. The highest ranked of the 30 largest U.S. metro areas in the Future Growth Momentum Index are:
1. Boston
2. New York City
3. Detroit
4. Washington, DC
5. Pittsburgh
6. Miami
There are some unexpected metros that rank highly for Future Growth Momentum, such as metro Detroit, Pittsburgh, and Miami. In addition, a surprising highly-ranked Future Growth Momentum metro is Los Angeles (ranked #7). Detroit and Pittsburgh have seen a fundamental redevelopment of the central city with Detroit also seeing substantial growth in its urbanizing suburbs. Miami and Los Angeles both are seeing strong center city growth plus revitalization of the late 19th century transit-served suburban WalkUPs. These suburban WalkUPs now have new rail transit investment which is spurring their growth in this real estate cycle.
In some cities such as Pittsburgh, Boston, and Denver, virtually all the growth in commercial real estate since 2010 has been in walkable urban places.
Report authors are Tracy Hadden Loh, PhD, Christopher Leinberger, and Jordan Chafetz. For more details on Foot Traffic Ahead, such as the social equity rankings, read the report.