Sprawling cities are becoming more urban


The largest 25 US “sprawling cities” are still growing at a tremendous rate this decade—but their growth now includes complete neighborhoods in addition to fragmented sprawl.
Sprawling cities—such as Houston, Phoenix, San Antonio, San Diego, and Dallas, predominantly in the Sunbelt—grew mostly during the “age of sprawl,” from 1950 to 2010. Although these cities have traditional downtowns and neighborhoods, conventional suburban development with drive-only thoroughfares covers the vast majority of their land area.
Sprawling cities define the modern American metropolis, and their recent struggles to reclaim traditional neighborhoods mirror a national trend. Their downtowns—neglected for many decades—have come back to life in the last two decades. “Downtown had a few hundred residents 20 years ago. Now it has more than 8,000—a number limited mostly by housing supply,” writes D Magazine of Dallas.
When it comes to growth patterns, sprawling cities matter. The largest 25 are home to 20.7 million people—and they anchor metro regions with 53 million people, about one-sixth of the US population.
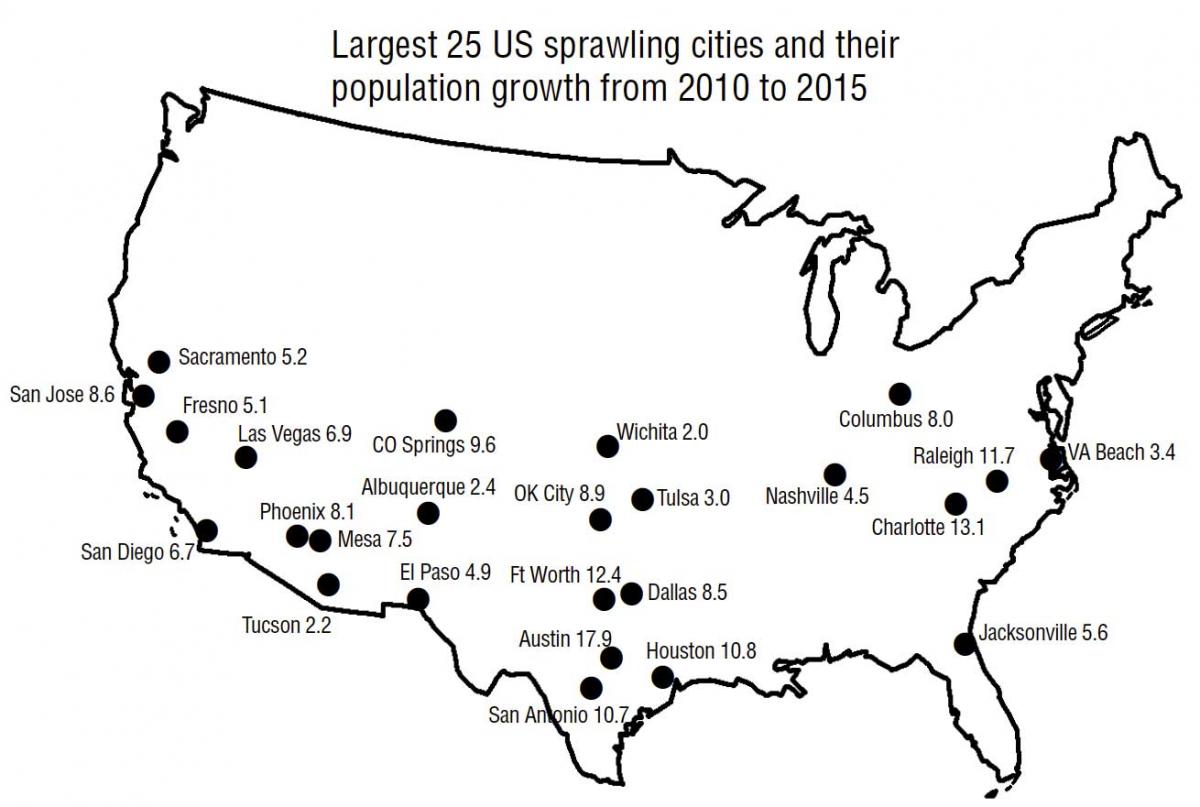
This may be hard to imagine today—but in 1950 these were compact, small- to mid-size cities. Only three—Houston, Dallas, and San Antonio—had a population of more than 400,000. Now they are the biggest US cities by land area and among the largest demographically—six have more than a million residents and Houston, the most populous, tops 2.3 million. Today, sprawling cities are becoming denser through infill, transit-oriented development (TOD) and suburban retrofit.
Sprawling cities have the capacity to grow in every direction—upward, inward, and outward. Their high rate of growth facilitates major new urban projects that wouldn’t be feasible in cooler markets, but also still accommodates conventional suburban development within their boundaries.
Urban form, infrastructure and demographics
These cities have below-average density, at 2,750 people per square mile. The average Walk Score is 40, which is very automobile-dependent. Nevertheless, some of these cities have excellent, distinctive, historic downtowns and a good supply of walkable neighborhoods in and around the core. Sprawling cities have a relatively high percentage of single-family detached housing—56 percent of total housing. In the largest traditional cities, that figure is only 22 percent.
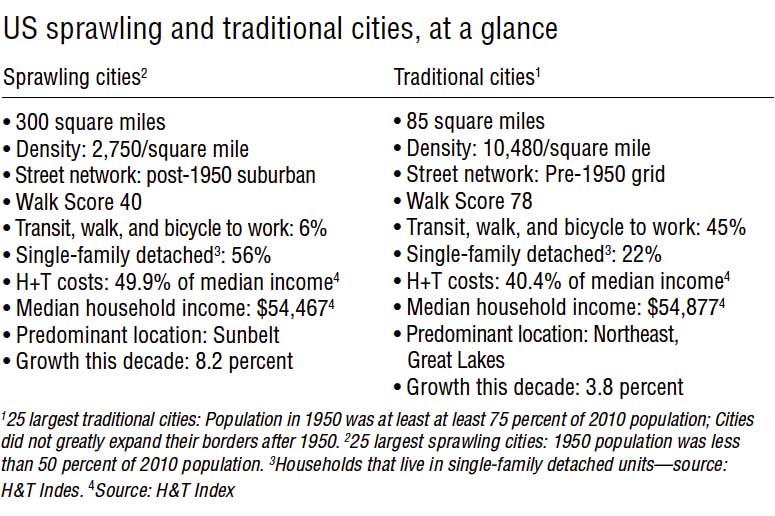
Because of the infrastructure and built patterns since 1950, only 6 percent of residents walk, bike, or take transit to work in sprawling cities. Because they are so automobile dependent, they impose much higher transportation costs on residents. Combined housing and transportation costs average about 50 percent of median household income, versus about 40 percent in traditional cities.
Sprawling cities are identified by their era of growth. In 1950 they had less than 50 percent of their 2010 population. Borders have expanded substantially through annexation and consolidation. They contrast with traditional cities, which had a 1950 population at least 75 percent of the 2010 population, with little post-1950 expansion of borders.
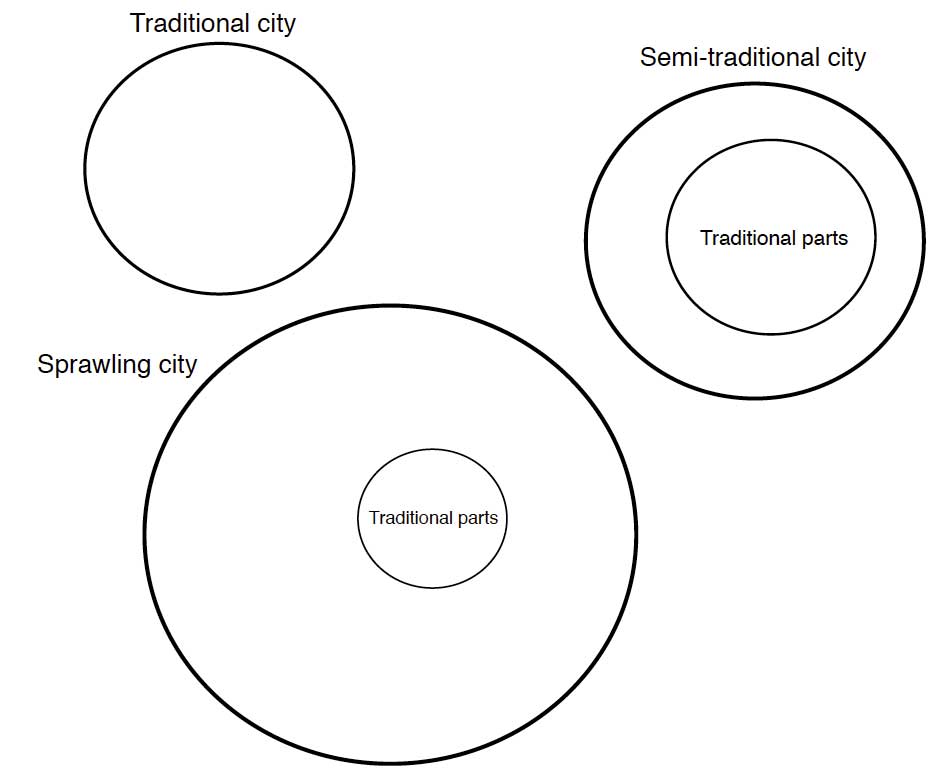
Traditional cities are mostly built on a grid. Sprawling cities mostly consist of conventional suburban thoroughfare patterns. In between are semi-traditional cities—like Los Angeles and Denver—comprised of about a 50-50 mix. Here’s a diagram that shows the approximate quantity of traditional neighborhoods in three types of cities—traditional, semi-traditional, and sprawling.
Sprawling cities are diverse places—about a third of the population is Hispanic. Average household income tops $54,000, which is about the same as traditional cities. Crime is relatively low in sprawling cities, although death and injury by automobile is higher than traditional cities.
Sprawling cities have much in common with many suburbs. Suburban street networks are major barriers to urbanism in sprawling cities. Despite widespread complete street laws and policies, the task of reforming vast post-1950 thoroughfare networks—or even getting engineers to seriously address the problem—is enormously difficult. Outside of traditional neighborhoods, walkable urban development in sprawling cities takes the form of nodes—around transit stops, where parcels can be retrofitted, and occasionally greenfield sites planned as complete communities.
Trends in sprawling cities
Many of these cities are investing in rail or other rapid transit, which forms an armature for walkable, mixed-use nodes to be built around stations. Phoenix’s Valley Metro light rail system has experienced substantial development around stations—helping the system to hit 50,000 riders a day in 8 years instead of 20, the projected target.
The Valley of the Sun is reforming some of its vast suburban fabric. “Phoenix has some of the best designed small-scale re-inhabitations of strip malls into great gathering spaces,” says Ellen Dunham-Jones of Georgia Tech University, author of Retrofitting Suburbia.
Phoenix has adopted form-based codes around transit stations. In that regard, Phoenix is like Nashville, El Paso, and Dallas. Austin also recently announced a zoning reform initiated for a transit-friendly downtown.
Light rail provides a framework for TOD in cities like Charlotte. Apartment buildings are going up all over Charlotte, aimed at attracting millennials, notes Curbed. More than 12,300 units were under construction at the start of 2016, with about 13,500 more planned. Charlotte is growing at the center and the edge, but “people are craving connectivity to each other and experiences, and those places that can deliver the most experiences in an accessible way can command premiums and value over time,” Curbed says, adding that to help settle the thousands on new arrivals, new developments need to create a more urban experience. One such plan would transform 1,300 acres between the airport and river into a new urban mixed-use district, with a waterfront.
Austin boasts large-scale retrofits. The city’s former Mueller Airport redevelopment is a new city sector built with new urban design about three miles from downtown. The Domain is a new urban center on the grounds of a former IBM manufacturing facility and campus, including the redevelopment of large parking areas. The Austin Community College re-inhabited the Highland Mall—with new housing to be built on the parking lots. Corridor rezoning has urbanized strip malls in the South Congress district—just across the river from downtown.
In San Jose, the Santana Row mixed-use town center—largely high-end retail, entertainment, and residential—proved the market for urbanism in a conventional suburban area three miles west of downtown. Now that Santana Row created a walkable center, it is getting a big influx of employment, says Dunham-Jones. More affordable urban projects followed in the Downtown. Corridors have been rezoned to allow for mixed-use compact development in San Jose.
Houston has numerous suburban retrofits, most notably CityCentre, the redevelopment of a mall into a mixed-use town center. This project is creating the physical framework for community in a part of the city that had none.
Nashville is benefiting from some of the “best missing middle housing and micro retail infill anywhere,” says Dunham-Jones. Three dead malls are being rebuilt in ways that increase diversity and walkability. New urban projects like the Gulch created more urbanism near downtown. Corridors leading to downtown are getting mixed-use-compact development.
Even Oklahoma is joining the trend. Guthrie Green, an urban park in Tulsa’s Brady Arts District, is ground zero for revitalization of “collar” neighborhoods near downtown. Oklahoma City has a major new urban infill project called the Wheeler District, 135 acres on a former airport a mile from downtown. The city recently approved $120 million in tax-increment financing for the new mixed-use neighborhood on the Oklahoma River that will have about 2,000 units of housing.
Regional urbanism
Metro areas of all kinds are becoming more urban and walkable in their growth patterns, according to research by Locus, a part of Smart Growth America.
The metropolitan areas encompassing sprawling cities have a “fair share index” of 2.3, which means that commercial development in their metro area is trending toward “walkable urbanism” at a ratio of about 2.3:1. The index measures the marginal market share increase or decrease for net absorption of real estate for a given time period, compared to market share at the beginning of that time period, Locus explains. [1]
The urban form of principal cities may influence urban patterns throughout metro areas. The regions centered by traditional cities have a fair share index of about 3, while the regions surrounding sprawling cities are becoming more urban—but at a slower rate.
Conclusion
Because of their era of rapid growth, sprawling cities experienced maximum fragmentation of the built environment. Now these cities have rediscovered the value of building cohesive neighborhoods and centers.
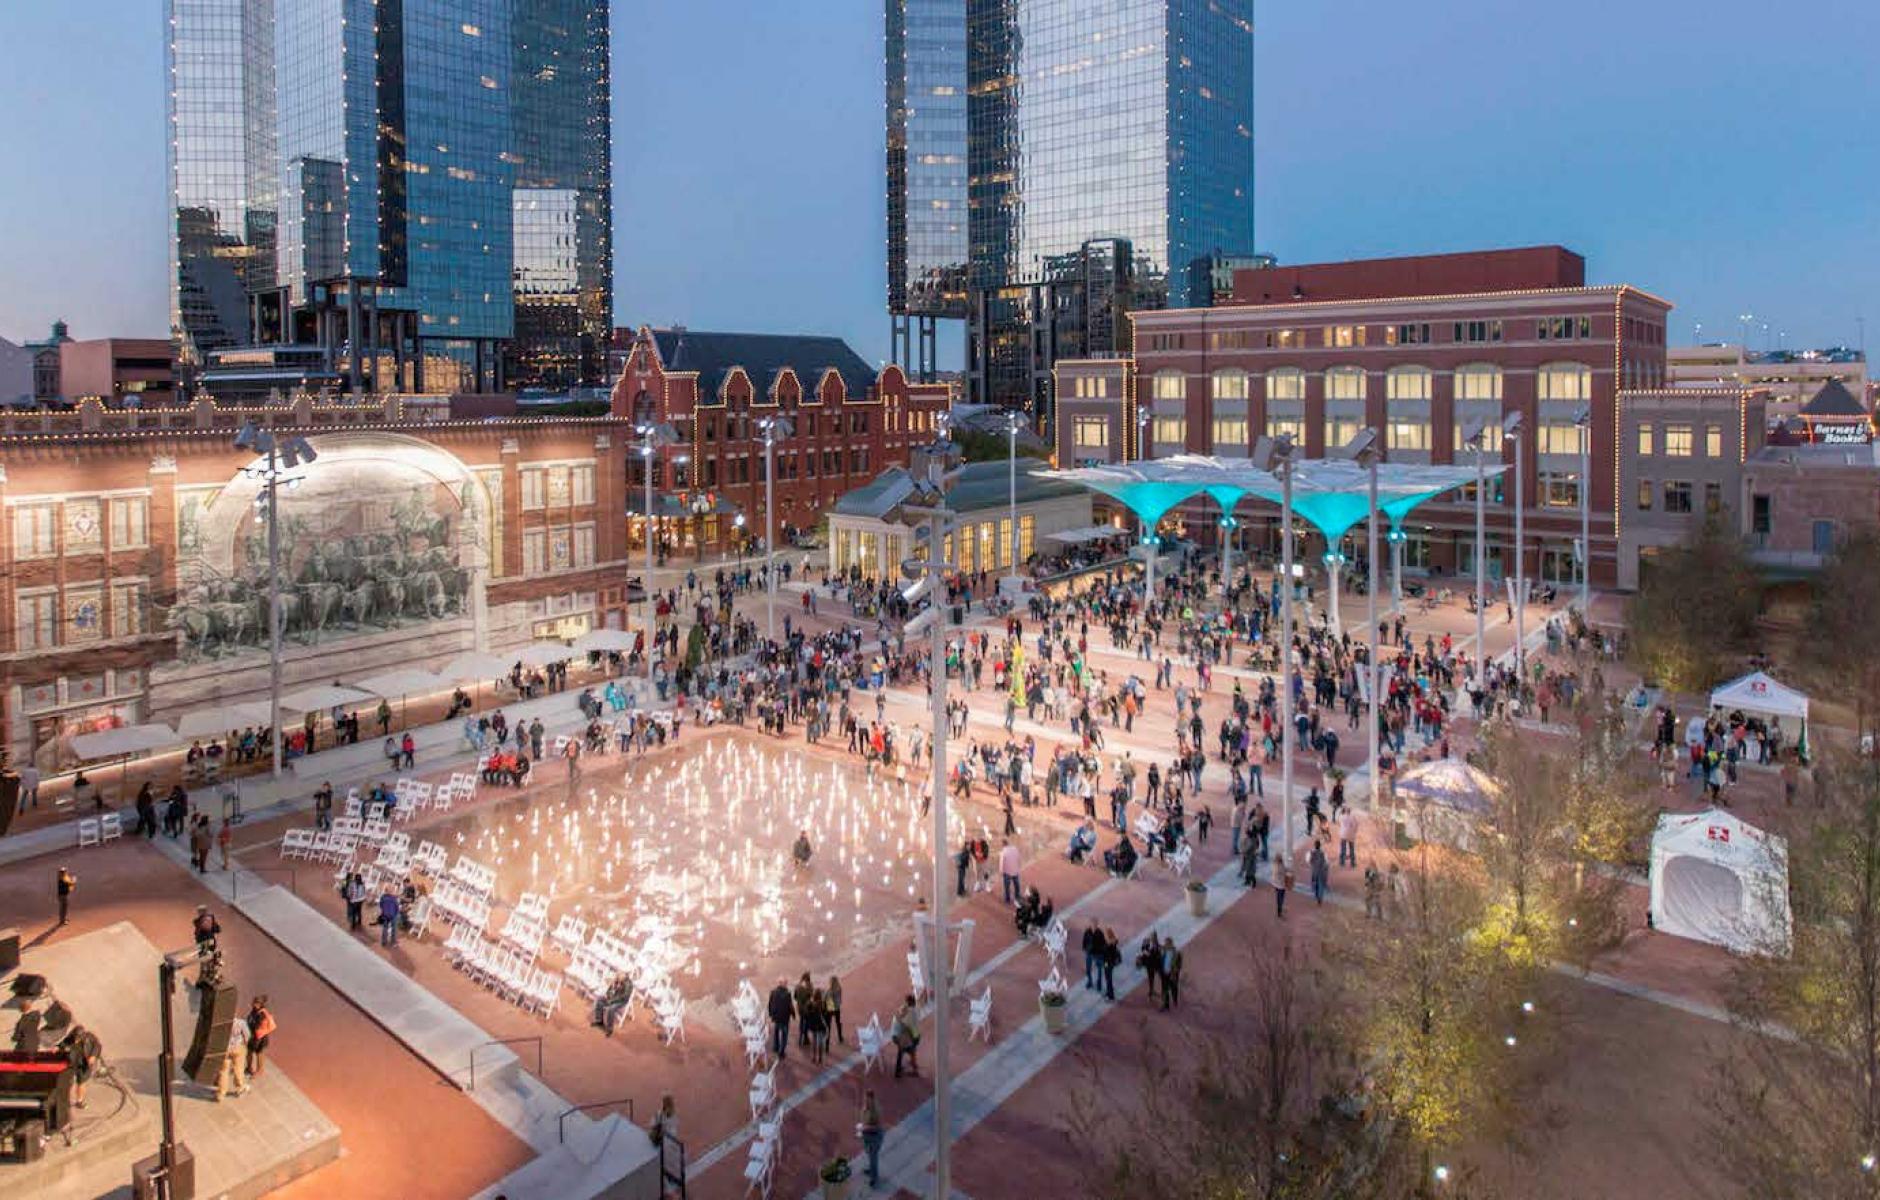
Downtowns of sprawling cities were among the first to revive. A prime example is Fort Worth, which rebuilt a walkable downtown over the course of two decades, culminating in the fabulous Sundance Square (see photo at top of article). The rising market for urban living has also brought back adjacent neighborhoods. Investments in transit are providing opportunities for walkable urban places. As major suburban malls and other facilities become obsolete, sprawling cities have the market strength to rebuild them as mixed-use centers.
In this age where walkable urban places are making a comeback, sprawling cities are developing cohesive neighborhoods and urban centers. Yet their conventional suburban fabric is vast and post-1950 street networks are difficult to transform. Sprawling cities will remain mostly sprawling cities, but their residents will have growing opportunities for walkable urban living.
[1] Average figure was determined by taking into account the relative population and fair share index of the regions where data is available from Locus.